Main Assignments:
3. Games
5. Software
6. Math Tools
8. Probeware
Statistical Analysis
Databases | Data | Spreadsheets | Graphing | Stats | Lesson | Problems | Main
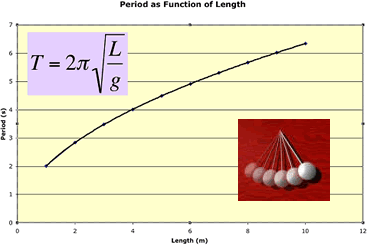
Determine the relationships between the length, mass and periods of a pendulum using trendlines

* Use regression analysis (trendline) to investigate and explain the relationship
between independent and dependent variables in the distribution of plants
or animals in a transect.
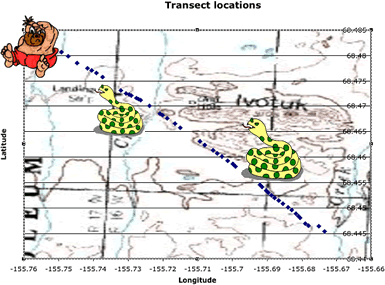
* Use a scatter plot to plot quadrat data on a topographical map and or
an aerial photograph.

Question: Why did they stop collecting data?
Other Places
